Getting started

This notebook demonstrates features of Anaconda Cloud for data access, notebook sharing, and application publishing. If you are new to Python, Jupyter Notebooks, or data science you may find these resources useful:

  • Python first steps
  • Jupyter Notebook Basics
  • Getting started with Anaconda

This notebook uses the anaconda-panel-2023.05-py310 pre-installed conda environment. It contains many of the most commonly used packages in data science and scientific computing. Additionally, the following packages are also installed:

  • Panel (version 1)
  • Anaconda Catalogs

Load data

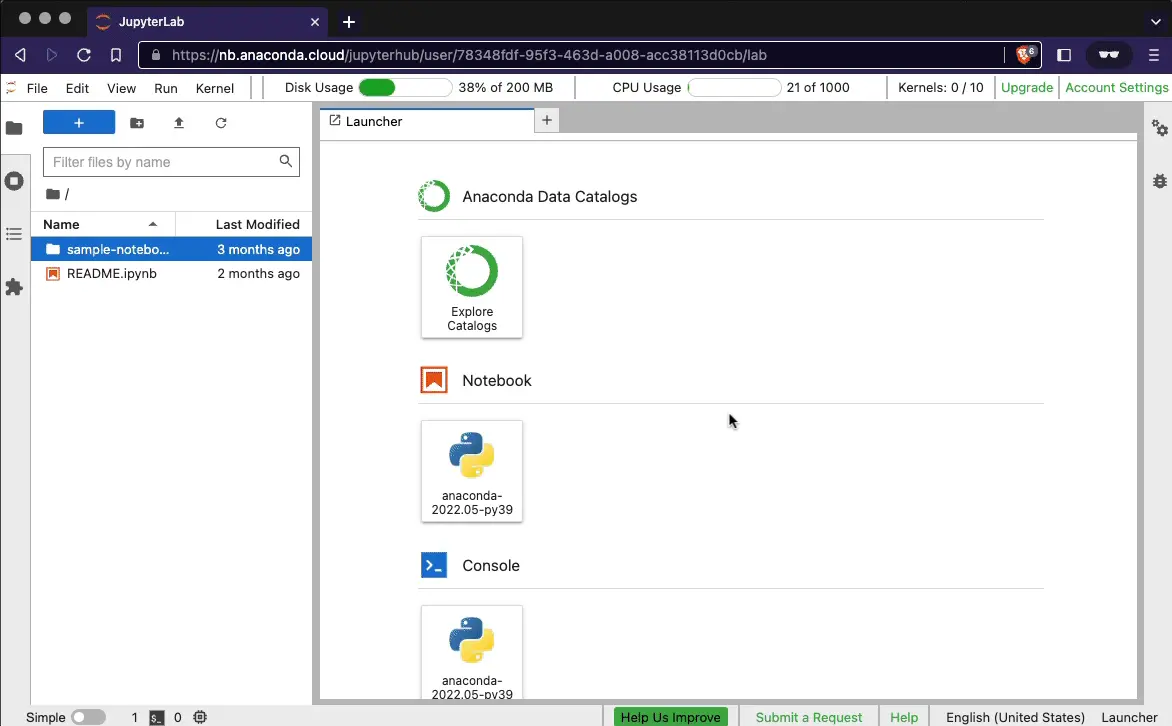
The Anaconda Data Catalog service provides data discovery in a JupyterLab extension and a driver for the open-source Intake framework. The anaconda-catalogs driver package helps you load data from the Anaconda Catalog service into Pandas DataFrames and other Python-based data structures.

You can view the available catalogs and datasets by clicking the Explore Catalogs tile in the Launcher. Then, open an example notebook to see a demonstration on loading the dataset.

See the Anaconda Cloud documentation to learn more about the Catalog service.

Catalogs

Example

The following commands are pulled from the penguins Data Catalog. Running the commands loads a table with information about the Adelie penguin:

In [1]:
import intake
In [2]:
cat = intake.open_anaconda_catalog("examples")
penguins = cat.penguins.observations.read()

penguins.head()
Out[2]:
studyName Sample Number Species Region Island Stage Individual ID Clutch Completion Date Egg Culmen Length (mm) Culmen Depth (mm) Flipper Length (mm) Body Mass (g) Sex Delta 15 N (o/oo) Delta 13 C (o/oo) Comments
0 PAL0708 1 Adelie Penguin Anvers Torgersen Adult, 1 Egg Stage N1A1 Yes 11/11/07 39.1 18.7 181.0 3750.0 MALE NaN NaN Not enough blood for isotopes.
1 PAL0708 2 Adelie Penguin Anvers Torgersen Adult, 1 Egg Stage N1A2 Yes 11/11/07 39.5 17.4 186.0 3800.0 FEMALE 8.94956 -24.69454 NaN
2 PAL0708 3 Adelie Penguin Anvers Torgersen Adult, 1 Egg Stage N2A1 Yes 11/16/07 40.3 18.0 195.0 3250.0 FEMALE 8.36821 -25.33302 NaN
3 PAL0708 5 Adelie Penguin Anvers Torgersen Adult, 1 Egg Stage N3A1 Yes 11/16/07 36.7 19.3 193.0 3450.0 FEMALE 8.76651 -25.32426 NaN
4 PAL0708 6 Adelie Penguin Anvers Torgersen Adult, 1 Egg Stage N3A2 Yes 11/16/07 39.3 20.6 190.0 3650.0 MALE 8.66496 -25.29805 NaN

Exploratory visualizations

Now that we have loaded the data into a Pandas DataFrame let's use HvPlot, Holoviews, and Bokeh to construct interactive visuaizations. HvPlot provides convenient plotting functions from the DataFrame object, which can aid in exploratory analyses.

In [3]:
import hvplot.pandas
In [4]:
colors = {
    'Adelie Penguin': 'SteelBlue',
    'Gentoo penguin': 'DarkOrange',
    'Chinstrap penguin': 'ForestGreen'
}

scatter = penguins.hvplot.scatter('Culmen Length (mm)', 'Culmen Depth (mm)', c='Species',
                                  hover_cols=['Sex'],
                                  cmap=colors, responsive=True, min_height=300)
scatter
Out[4]:

More sophisticated interactivity

Holoviews provides the capability to build sophisticated interactivity. In the following visualization, selections between the scatter and bar charts are linked. You can use the box selection tool in the scatter graph to select a group of points, and only those points will be represented in the bar chart below.

In [5]:
import holoviews as hv
import numpy as np

histogram = penguins.hvplot.hist('Body Mass (g)', by='Species',
                                 color=hv.dim('Species').categorize(colors),
                                 legend=False, alpha=0.5, responsive=True, min_height=300)

ls = hv.link_selections.instance()

linked = ls(scatter.opts(show_legend=False) + histogram).cols(1)
linked
Out[5]:

Share your work

You can share your Jupyter notebooks with other users within the Anaconda Cloud notebook platform:

  1. Click the share icon in the tool bar.
  2. Enter a unique name for your notebook, then click OK.
  3. In the Share Link Generated dialog:

    1. Click the Copy icon to copy the notebook link to your clipboard. You can then share this link with whomever you want to share the notebook.
    2. Click the Notebook icon to copy the notebook badge to your clipboard. You can then add this badge to a webpage.

Both links can be used to share your work. Users who do not have an Anaconda Cloud account who click the badge will be prompted to create an account.

Sharing

Building applications with Panel

Using the Holoviews plots created above let's use Panel to build an interactive dashboard.

Clicking the Render with Panel icon in the tool bar to preview the dashboard.

NOTE: The contents of the panel may take a minute to load.

Preview

In [6]:
import panel as pn

def counts(selected):
    return pn.pane.Markdown(f"## {len(selected)}/{len(penguins)} penguins selected", align='center')

logo = 'https://allisonhorst.github.io/palmerpenguins/logo.png'
app = pn.template.BootstrapTemplate(logo=logo, title='Penguins crossfilter')
app.header.append(pn.bind(counts, ls.selection_param(penguins)))
app.main.append(linked)

app.servable();

Publishing and sharing applications

To publish your Panel application a custom URL on Anaconda Cloud:

  1. Click the rocket ship at the top of the notebook. The publication panel opens on the right.
  2. Provide a title and detailed description.

NOTE: The form displays your notebook version, which will update through iteration and redeployment.

  1. Click Publish.
  2. Click the rocket ship tab in the left-hand navigation to open the Apps panel. Your application is now listed under Active.

Publish

Learn more

  • Anaconda Catalogs
  • Panel/Holoviz getting started guide
  • Awesome Panel
  • More example catalogs